PV Array Sizing, MPPT & 3 phase Grid Connection for 50kWp Solar Project
If you are intersted in project files only find it here - Github Repo for the project.
As a research engineer in the Renewable domain, I had the privilege to understand the systemic innovative approach leading countries in renewables are taking. During this period, I went through IRENA reports, and NREL research articles on Solar energy at scale- on the grid and beyond the grid, I also had insight on several case studies that IRENA has put forward in its Innovation landscape for renewable powered future IRENA . Renewable-powered future is only possible if major actors in this domain put a systemic innovative approach via i)enabling technologies ii) innovative market design iii) innovative business models iv) drastic changes in power system operation and v) better policy enabling grid flexibility. I also went through Nepal Energy Sector Synopsis Report -2022 NESSR that gives the status of the energy sector in Nepal and AEPC plans and ambitions on greener energy for Nepal. As I display this project I shall also add a few other news articles that give an insight into Nepals Energy Sector emphasizing Electric Power.
Technically, this project is specifically a continuation of the previous project where we had already calculated incident energy on a tilted PV array. However as a learning experience, I am adding what I learned during the adventure.
Brief Energy Outlook of Nepal
Acoording to NESSR energy supply is divided into 3 major sources in Nepal, viz. Traditional Sources comprising of fuelwood, Agri biomass, etc, Modern Renewables include Solar PV, micro hydropower, wind, and biogas and Commercial Energy Sources include installed capacity by NEA, the country's only power utility. The energy consuption is divided in a similar fashion. As of 2021, still, traditional sources of energy are the dominant source of end-use Energy in Nepal; having a share of 66%, and of commercial and renewable has shares of only 31% and 2.4%. If the energy consumption is divided by sectors as of 2021, the Residential sector consumes almost 64% of energy, the industry consumes only 18% and transport consumes 9% of energy indicating the country's poor economic progress. Ministry of Electricity, Water Resources, & Irrigation released a white paper 2075 in July 2018 with objectives to elevate renewable energy generation in the coming decade to take the country towards the path of sustainable development, which does not seem feasible analyzing the country's current energy scenario. Nepal's SDG Status and Roadmaps 2016-2030 emphasizes three sectors mainly clean energy, agriculture, and tourism for the sustainable prosperity of the nation. Nepal's 20 Year Renewable Energy Perspective Plan 2000-2020 has an ambitious goal to increase installed capacity of Renewable Sources to 894MW by 2030. However without proper homework in major sectors all these plans seem to be only promises in the papers. As of 2022, this article Where is Synergy in Nepal's Energy Policy discusses one of the bottlenecks that Nepal is facing in its path to Greener Energy. AS of 2022, another artcile Call for Better Policy urges government for better policy to increase Solar Power in Renewable Mix. Although the country has aspiring goals for SDG and Renewables, major work is required in several sectors with several actors contributing for the same goal.
Brief Solar Portfolio of Nepal
Nepal is located in an advantageous location and high altitude topography, with slopes facing south, receives solar irradiation, and is advantageous to harness solar energy. The average solar incident energy varies from 3.6-6.2kWh/m2/day, and the sun shines for about 300 days a year. As per the published report of AEPC, 2008 under Solar & Wind Assessment in Nepal(SWERA), the commercial potential of solar power for grid connection is 2,100 MW. Nepal has great potential for at least four types of solar energy technology: grid-connected PV, solar water heaters, solar lanterns, and solar home systems. AEPC also states that even if only 2% of the best solar irradiance is used for power generation, 1829 MW of electricity can be generated via Solar.
As of 2021, there have been 961 thousand residential Solar PV systems installed in Nepal. The major Solar Home Systems (SHS) installations have been in rural Nepal where grid electricity is either not possible or is very poor. Photovoltaic Pumping Systems (PVPS) for drinking water are also installed in hilly belts where people need to travel over a long distance for drinking water supply. Under Large Scale Utility Project, 25MW Solar Project is connected to the grid under NEA. NEA also stated it has PPA with 21 solar projects to purchase 110MW electricity. To conclude, Nepal must harness the vast possibility that Solar Power has in Nepal.
Technical Insight on the Project
It is clear Renewable integration to the grid is better from all perspectives as it brings better grid flexibilty, it is also sustainable & green source of energy that is much quicker to install compared to large hydropower installations. However, integration of renewables to the grid comes with several technical challenges. Renewable energy is variable and uncertain source of energy, there must be good technical framework that supports this type of energy. Some framework includes better forecasting models, available storage facilities, interconnection capability to neighboring cities/region so that grid is much flexible to cope the intermittency of the renewables. Grid management also plays key role to install more renewables into the grid.
In 2013 report CAISO shared a chart that predicted the impacts of increased renewable integration to the grid from 2012 through 2020 that quickly became known as the “Duck Curve” because of its vague resemblance to a duck. This curve depicts the existing conventional sources of energy should be much flexible to maintian green grid reliability. In aggregate, great technological framework is required as renewable penetration to the grid increases.
For our Solar Power Plant Project, previously, we had scripted a MATLAB file for incident energy calculation in tilted PV panels with atmospheric effect taken into account. The incident energy calculation provided us with a graph of incident energy on our latitude throughout the year. The MATLAB script can be found here. The result is a Hat estimated graph as shown below:
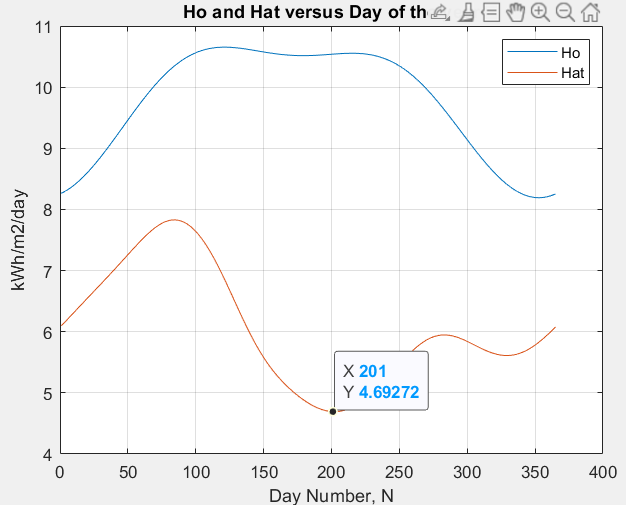
- Number of PV panels required : From the graph it is clear that the minimum incident energy is 4.69 kWh/m2/day on 201th day of the year for our location. We must size our PV panels taking this value Hat(min) = 4.69 kWh/m2/day. Taking minimum value of Hat to size PV panels ensures that even at worst conditions with the least incident energy on solar panels we are able to provide the required energy to the load. The data analysis team reported that the average load of our site was 6882 kWh/month. This gives an average daily load of 229.4 kWh/day. This is the energy required to be fulfilled by our Solar Plant Eout = 229.4 kWh/day. I have provided a complete Excel Sheet with formulae and automated calculations required for the project Excel Sheet. I shall only list the formulae implemented for the calculation. Total energy input by the incident radiation over the area of PV panels in \(Ein = Hat(min)*Area(panel)\). Total energy output by the PV panels is Eout = \({\eta}\)*Ein. Substituting the value of Ein we get $$Area(panel) = {Eout \over ({\eta}*Hatmin)}.$$ The effeciency of PV panel can be calculated by referring to its datasheet. For calculating effeciency, the formula is: $${\eta} = {(Vmp*Imp) \over (L*Area of PV module)}.$$ L is standard insolation of 1 \(kW/m^2\) which is standard testing condition (STC) for PV panels. Area for each module is given by datasheet. Four our case it is length = 1.64 m and breadth = 0.992 m. Vmp and Imp are maximum power current and maximum power voltage for PV module, found in datasheet. So with a effeciency of 0.14, we get area of panel required as \(345.92 m^2.\) Number of panels required is simply total area divided by area of each module which comes out to be 214.
The peak power rating of the plant comes out to be 214*Vmp*Imp = 50 kWp. That gives the power rating for our Solar Plant which feeds at least 229.4 kWh/day of energy. - MPPT Concept : Maximum Power Point Tracking is a major concept for both grid-tied & isolated solar plants. As seen on the graph above, the incident energy varies during a day, between days for a complete year. Different incident energy yields different power from the PV plant. We are at worst guaranteed 50 kWp. However, 50 kWp is the maximum power for Hatmin. For varied Hat, the maximum power also varies. Our PV panels are slow to react for changing incident irradiance on PV panels. So we must search for the maximum power point for given irradiance. This searching/tracking phenomenon is referred as Maximum Power Point Tracking. There are several algorithms for Maximum Power Point Tracking (MPPT). We follow Hill Climbing / Perturb and Observe (P&O) algorithm, in our case, one of the classical online MPP techniques. Hill Climbing algorithm works on the concept that the change in power at maximum point of hill is zero for small voltage change. So, we perturb the voltage in search of maximum power point & observe the point, if the point is found, we stay there, else we perturb again and search until the MPP is found. Once the MPP is found, the system will oscillate about the MPP. Choice of stepsize while searching the MPP, affects the operation of MPPT, also the time it takes to reach the MPP defines the system characteristic. So I tried multiple values and reached to suitable values. Maybe there are better ways to find step-size. The complete MPPT model & algorithm is included inside the project in this file.
- Grid Connection Principle : We want power to be fed to the grid such that maximum active power from the PV panel via MPPT is put into the grid. For maximum active power transfer between the MPPT and the grid, the current fed by the MPP, Imp must be in phase with the grid voltage (Vgrid). The PV to Grid topology in our case is a single power stage topology where MPPT algorithm is built inside the inverter. The MPPT algorithm produces varying duty cycle that controls the switching of 6 IGBT/diode switches. A very basic layout of the PV>>inverter>>Grid is shown below:
 Basic Layout of PV to Inverter to Grid (3 phase)
From the figure above applying KVL across the loop, assuming inverter is feeding power to the grid: Vinv = VL + Vgrid; VL = Vinv - Vgrid; $${LdIL \over dt} = {Vinv - Vgrid}.$$ $$IL = {∫(Vinv - Vgrid) \over L}.$$ This the maximum power current via MPPT through the inverter. This current IL must be in phase with Vgrid such that P = Vgrid*IL*cos\({\phi}\) is maximum. In order to make IL in phase with Vgrid, Vgrid's phase is taken as the reference phase and the current is made in phase with Vgrid's phase. However, the current we have is 3 phase in nature, constantly pulsating. The 3-phase current tracking is complicated and does not yield better results, so we opt set point control. Set point control is only possible if we have to track single value/DC quantities. 3-phase current is transformed to 2-phase DC quantities using abc-dq transformation. This 2-phase DC quantity is easier to control. Id and Iq are the two-phase DC quantities. Inorder to conrol these Id and Iq components we need a reference for each Id & Iq. The reference to id; Iref is the maximum power current from Solar PV panel & MPPT. The reference to Iq is Iqref. Iqref is put to zero. The logic here is: the voltage space vector for grid is given by: $$Vgrid ={Va*e^{j0} + Vb*e^{j*2pi/3}+Vc*e^{j*4pi/3}}.$$ The space vector for inverter current is $$IL = {Ia*e^{j0} + Ib*e^{j*2pi/3}+Ic*e^{j*4pi/3}}.$$ The d-q axis is positioned in such a fashion that the d axis aligns exactly with the voltage space vector Vgrid. This concludes, voltage space vector Vgrid has only d component Vd and Vq = 0 for Vgrid. In our grid connection principle for maximum active power transfer, we want Vgrid and IL in phase with each other. To meet that requirement, IL aligns with Vgrid, Vgrid is entirely in d-axis so IL also has only d component Id and Iq = 0. So, we always want Iq = 0 for active power transfer. Thats why we set Iqref = 0. While reference for Id comes from MPPT as Iref. After closed loop control of Id and Iq, we obtain Idref and Iqref as output, which is fed into dq0 to abc transformation. This results ref as output signal. ref is put into pulse width modulator as message signal and with a carrier signal at high frequency it is modulated to produce duty cycle for the IGBT/diode of inverters. This procedure ensures maximum active power is transferred to the grid from PV panels. Note: also point to be noted is two voltage source can not be paralleled direclty so we put Inductor between them.
- DC link Capacitor C and Filter Inductor L : Capacitor placed across the PV array at the point of common coupling (PCC) is the DC link capactior. DC link capacitor maintains steady voltage output from the PV array incase of sudden fluctuation in irradinace. This ensures constant & ripple free Imp which is used to generate reference current Iref for current control. DC link capacitor maximizes MPPT stability. The formula for calculation is taken from a book and included in the script file itself. Filter Inductor ensure ripple free/constant current output from current source inverter to thr grid. Its size is determined from ripple percentage we want to attenuate. The formula is already in the script file.
Results & Discussions
Under results and discussions section I have kept all the simulation results.
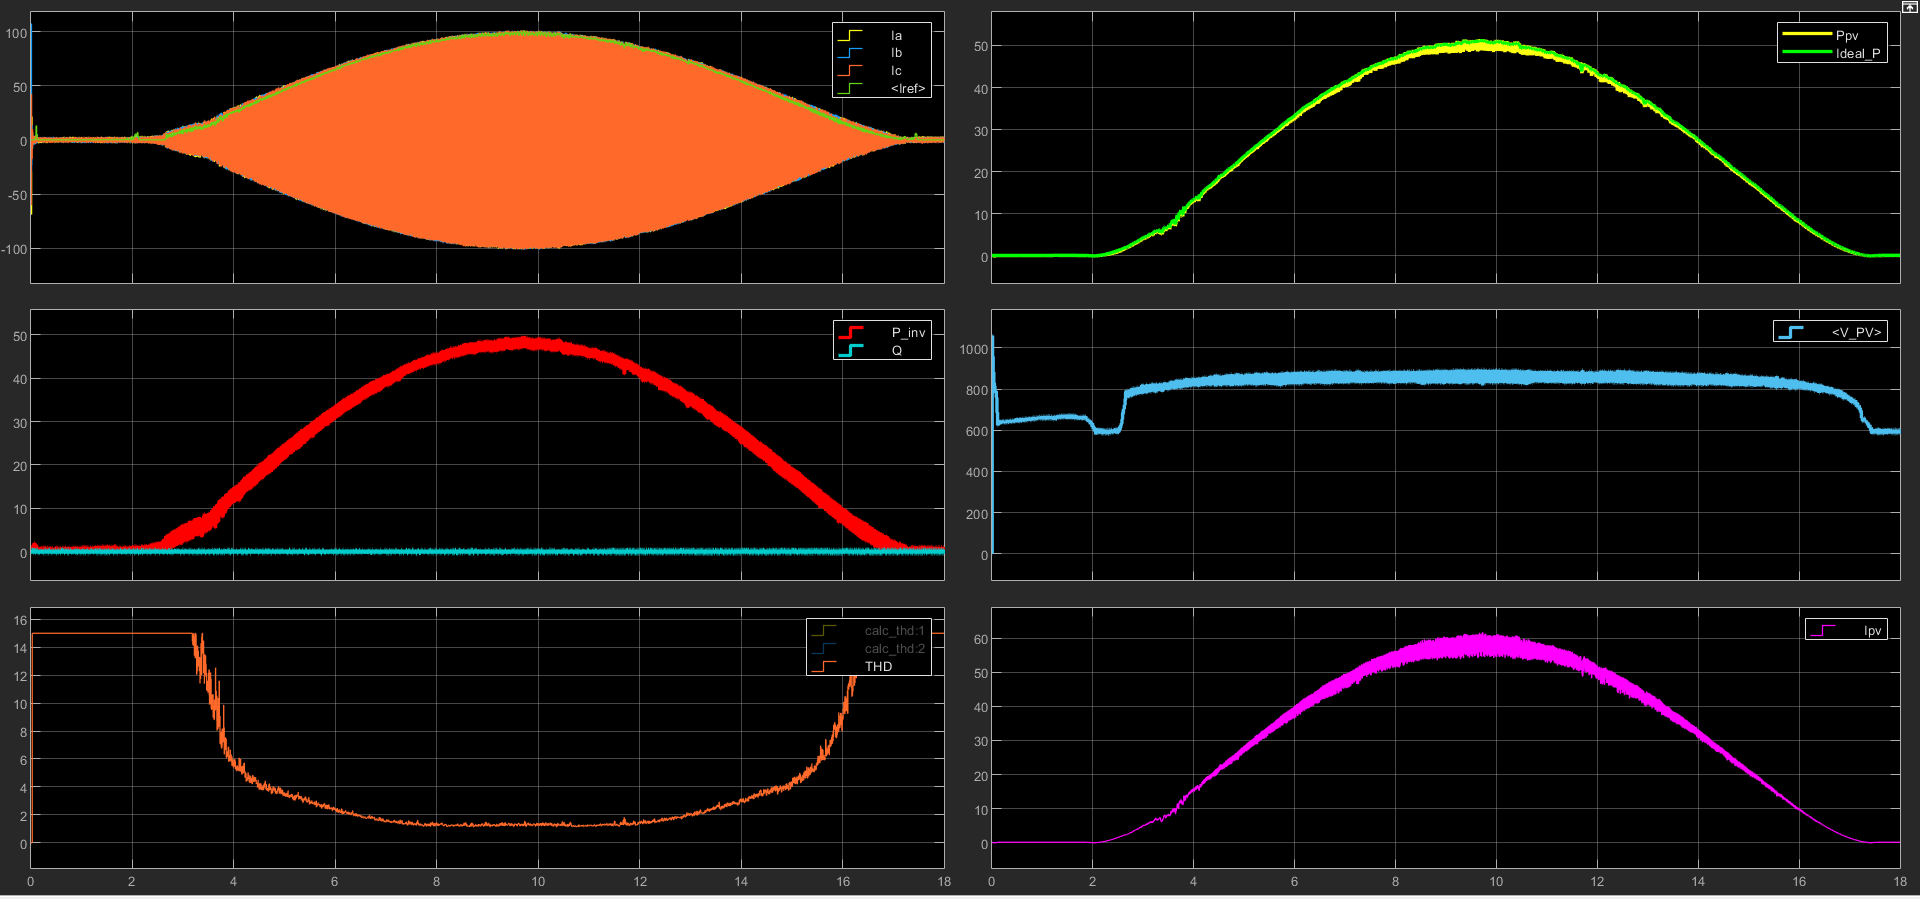
First graph shows Ia Ib Ic and Iref, Iref is generated by MPPT for maximum power tracking. Following the Iref curve, in second graph power output from inverter is 50KwP for irradiance of 4.69; however I have changed irradiances in this scenario to much lower values to see how the system behaves. Also reactive power output is almost zero in the second graph which is our major objective. Third grpah shows Total Harmonic Distortion(THD) is almost below 5% for high power applications which is appreciable. Graph 4 shows power output from PV module, it is tracking maximum power at varied irradiances. Graph 5 depicts almost constant output voltage = 800V from PV array with graph 6 showing maximum current during varied irradiance.
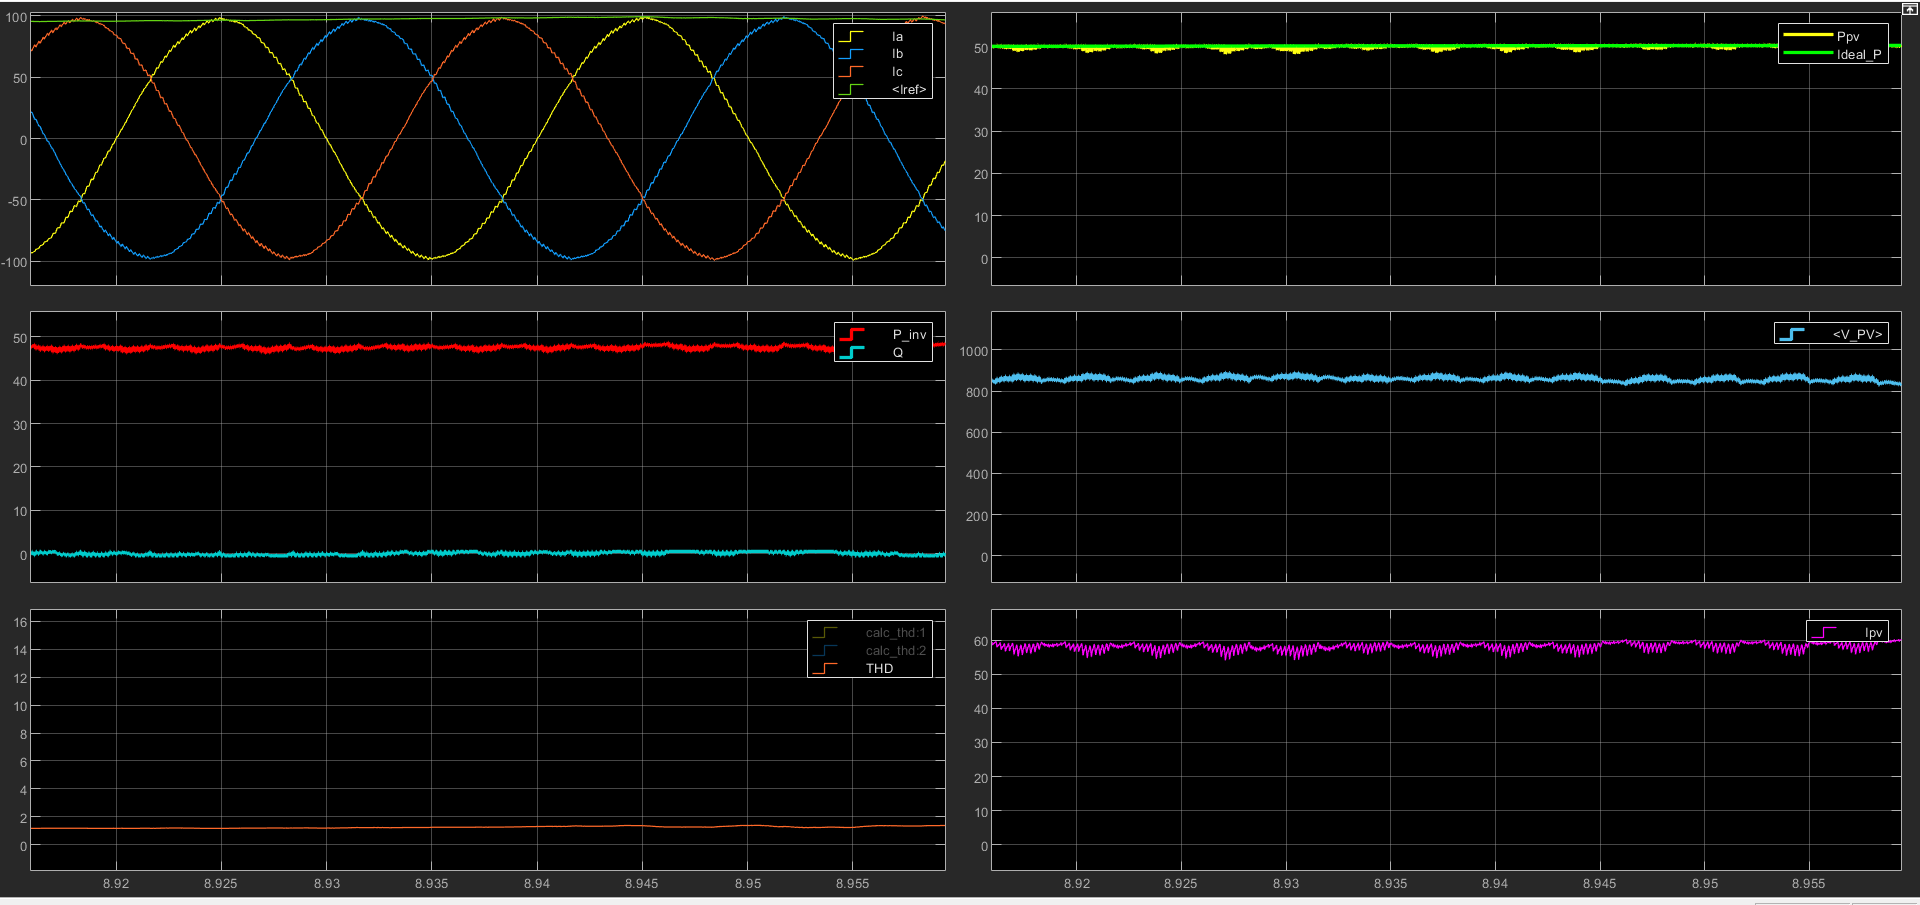
This figure illustrates the results in much clear manner with a zoom factor. We can visulaize sinusoidal ac input/current to the grid from the inverter. Also several other results are zoomed.
I have created a repository for the project repo. You can discuss the project with me in the repo too.
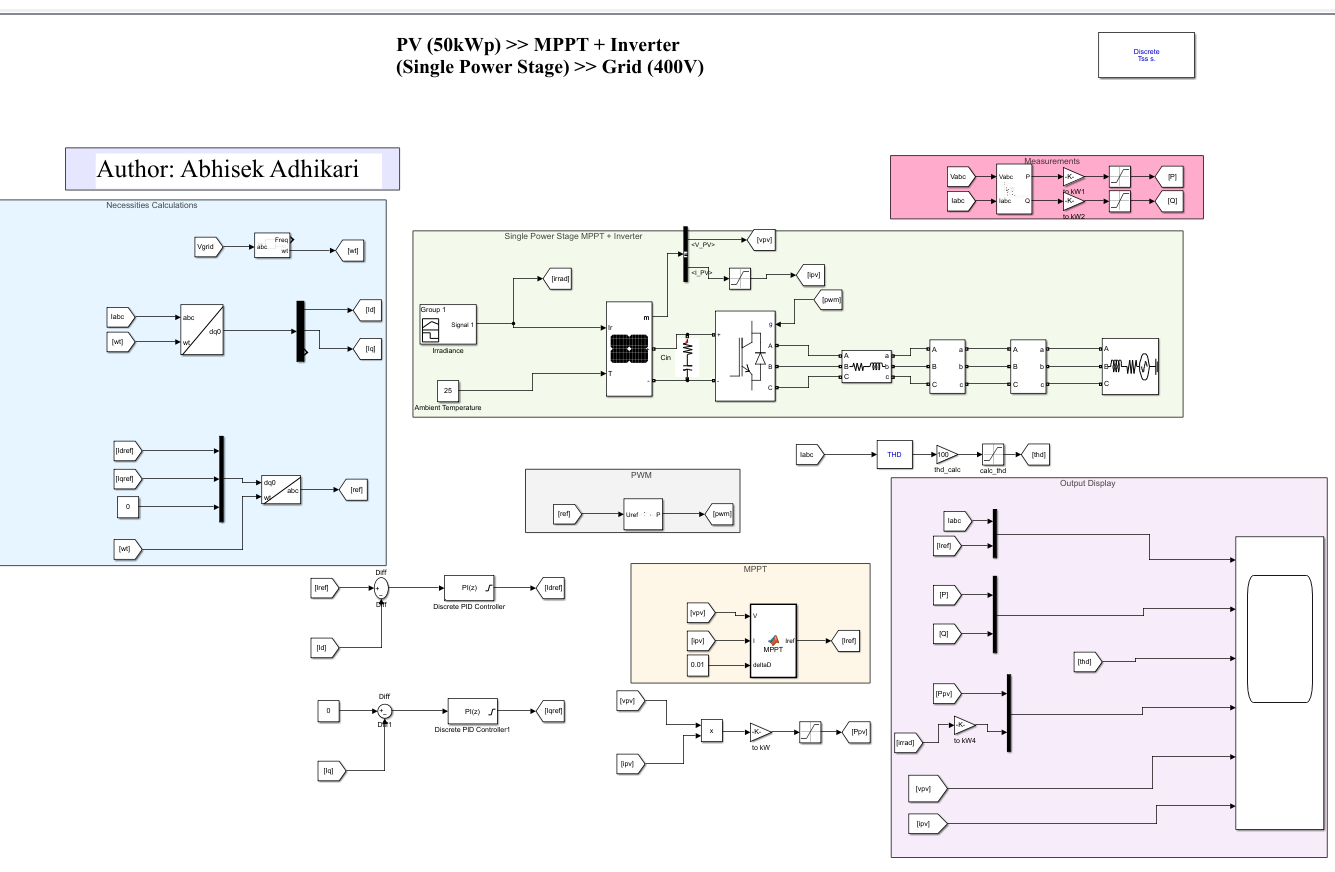
The final project seems like this in entirety: